
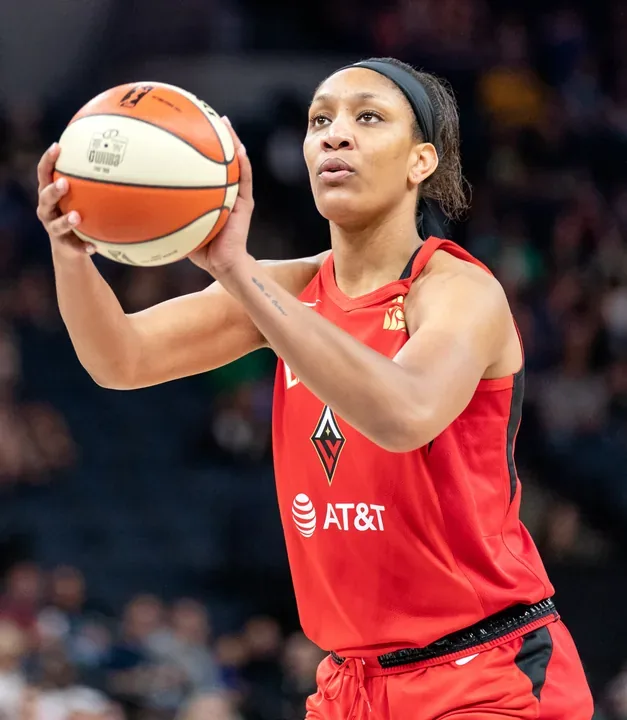
Through games completed on August 26, 2026, A'ja Wilson led the qualified WNBA scoring table at 26.0 points per game, Angel Reese led rebounding at 12.4 per game, and Alyssa Thomas and Caitlin Clark were level at a displayed 8.3 assists per game. Thomas appeared first on the WNBA's official assists leaderboard, but the public one-decimal values were tied; it would be misleading to invent a separation that the displayed data did not show. Wilson had played 36 games, Reese 37, Thomas 36 and Clark 35 at this cutoff.
This article is a dated statistical snapshot, not a live leaderboard and not a declaration of the final 2026 winners. The regular season was still in progress, so every average, total and order below could change after the cutoff. Games played matter as much as the headline rate: official leader eligibility uses minimum participation or cumulative-production thresholds, and a player can lead a per-game category without leading its season total.
The sections below use the WNBA's official regular-season leader data as the controlling source. They compare qualified per-game leaders with totals, explain the league's minimums and separate three different ideas that are often blurred together: a current season lead, an officially confirmed record and a career milestone. That distinction also keeps this guide separate from an opinion-based ranking of the league's best players.
Cover photo: A'ja Wilson, photographed by Lorie Shaull via Wikimedia Commons, licensed under CC BY-SA 2.0; resized and converted to WebP. The photograph predates the 2026 season.

2026 WNBA stat leaders at a glance
The quickest way to read the late-August leaderboard is to keep the rate and the sample together. Each entry below shows a qualified per-game average followed by games played in parentheses. These are regular-season figures through August 26, not projections over a full 44-game schedule.
| Rank | Points per game | Rebounds per game | Assists per game |
|---|---|---|---|
| 1 | A'ja Wilson, Las Vegas — 26.0 (36 GP) | Angel Reese, Atlanta — 12.4 (37 GP) | Alyssa Thomas, Phoenix — 8.3 (36 GP) |
| 2 | Kelsey Mitchell, Indiana — 24.8 (39 GP) | Jessica Shepard, Dallas — 11.1 (37 GP) | Caitlin Clark, Indiana — 8.3 (35 GP) |
| 3 | Caitlin Clark, Indiana — 22.1 (35 GP) | A'ja Wilson, Las Vegas — 9.5 (36 GP) | Jordin Canada, Atlanta — 7.4 (37 GP) |
| 4 | Kahleah Copper, Phoenix — 20.9 (37 GP) | Shakira Austin, Washington — 9.5 (37 GP) | Chelsea Gray, Las Vegas — 6.8 (38 GP) |
| 5 | Marina Mabrey, Toronto — 20.8 (32 GP) | Kiki Iriafen, Washington — 9.3 (35 GP) | Jackie Young, Las Vegas — 6.6 (38 GP) |
Two visible ties need care. Thomas and Clark both rounded to 8.3 assists, while Wilson and Austin both rounded to 9.5 rebounds. The table preserves the order returned by the WNBA's official leader pages, but the displayed tenths alone do not justify saying one tied player had a larger unrounded average. Games played also explain why this is more than a list of numbers: Clark appeared in both the scoring and assist top threes despite playing fewer games than several nearby players, while Mabrey had only just cleared the full-season 31-game participation benchmark used in a 44-game season.
Because this snapshot stops before the August 27 slate, the next result can change a rate, a total or both. Use the full 2026 WNBA schedule to see the remaining opportunities, then return to an official stats tool for the newest leaderboard. The rest of this guide explains how eligibility and totals shape what those rankings mean.
How WNBA players qualify as official stat leaders
A big average does not automatically make a player an official WNBA leader. The league applies statistical minimums so a short hot streak is not compared on equal terms with production sustained across most of a season. For the 44-game 2026 regular season, 70% participation is expressed as 31 games. Several counting categories also offer an alternative cumulative route, which matters for a productive player who has missed time.
| Leader category | 2026 full-season minimum |
|---|---|
| Scoring | 31 games played or 525 points |
| Rebounds | 31 games played or 250 rebounds |
| Assists | 31 games played or 150 assists |
| Steals | 31 games played or 55 steals |
| Blocked shots | 31 games played or 40 blocks |
The word or is essential. A scorer does not have to satisfy both 31 appearances and 525 points. If she reaches the points threshold in fewer games, the cumulative route can make her eligible for the official scoring list. The same logic applies to the 250-rebound and 150-assist alternatives. Conversely, a player can post an eye-catching average in a small sample and remain outside the qualified table until one of the two conditions is met.
Percentage categories work differently because opportunity is measured by made shots. The official minimum is 100 field goals made for field-goal percentage, 50 free throws made for free-throw percentage and 25 three-pointers made for three-point percentage. Those standards prevent a player who makes one of one attempts from being presented as a 100% season leader. Assist-to-turnover ratio has its own 50-assist minimum, so it should not be assumed to use the same 31-game rule as assists per game.
Qualification is an eligibility rule, not a verdict on player quality. An injured star's rate still describes what happened while she played; it simply may not qualify for an official league-leader label. This article follows the qualified WNBA tables for its ranked lists and then uses GP and totals to preserve the availability context. The minimums above are full-season standards published for a 44-game schedule, while the official site applies its leaderboard logic as the season progresses.
Scoring leaders: per-game pace and total points
A'ja Wilson owned the fastest qualified scoring rate at the cutoff, averaging 26.0 points in 36 games. Kelsey Mitchell was next at 24.8 points across 39 appearances, but those three additional games helped Mitchell lead the league in total points. That is the cleanest example of why “scoring leader” needs a named measure: Wilson led points per game, while Mitchell had accumulated more points.
| Qualified PPG rank | Player | GP | PPG | Total points |
|---|---|---|---|---|
| 1 | A'ja Wilson, Las Vegas | 36 | 26.0 | 935 |
| 2 | Kelsey Mitchell, Indiana | 39 | 24.8 | 967 |
| 3 | Caitlin Clark, Indiana | 35 | 22.1 | 775 |
| 4 | Kahleah Copper, Phoenix | 37 | 20.9 | 775 |
| 5 | Marina Mabrey, Toronto | 32 | 20.8 | 667 |
Mitchell's 967 points were 32 more than Wilson's 935, even though Wilson scored 1.2 more points per game. There is no contradiction: PPG asks how much a player scored in an average appearance, whereas the total rewards both nightly output and availability. Clark and Copper provide another useful comparison. Both had 775 points, but Clark reached that total in 35 games and Copper in 37, producing different averages and different positions on the rate table.
Mabrey's place also shows why qualification and volume must be read together. Her 32 appearances put her just beyond the 31-game full-season participation benchmark, and her 20.8 average ranked fifth in the official order. Her 667 total was much farther down the cumulative list because the players around her rate had generally appeared more often. No total in this table was estimated by multiplying a rounded average; each came from the WNBA's totals view.
Wilson's scoring lead is a statistical fact at this cutoff, not by itself an MVP result or a declaration that she was automatically the league's best all-around player. Readers who want the games behind her remaining opportunities can use the Las Vegas Aces schedule. For an explicitly subjective mix of production, efficiency, role and defense, see our separate Top 25 player analysis; it answers a different question and uses an earlier snapshot.
Rebounding leaders: rate, volume and offensive rebounds
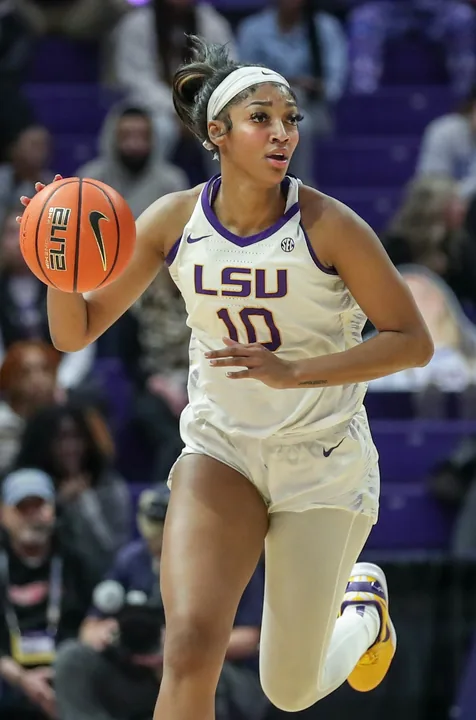
Angel Reese led every qualified player at 12.4 rebounds per game and also held the cumulative lead with 458 rebounds in 37 appearances. Jessica Shepard followed at 11.1 per game and 410 total. The size of Reese's advantage was not just a matter of collecting defensive misses: 187 of her rebounds came on the offensive end, an average of 5.1 per game. That second-chance production is central to understanding both her lead and the official record context discussed later.

| Qualified RPG rank | Player | GP | RPG | Total REB | OREB / DREB |
|---|---|---|---|---|---|
| 1 | Angel Reese, Atlanta | 37 | 12.4 | 458 | 187 / 271 |
| 2 | Jessica Shepard, Dallas | 37 | 11.1 | 410 | 106 / 304 |
| 3 | A'ja Wilson, Las Vegas | 36 | 9.5 | 341 | 65 / 276 |
| 4 | Shakira Austin, Washington | 37 | 9.5 | 350 | 74 / 276 |
| 5 | Kiki Iriafen, Washington | 35 | 9.3 | 327 | 105 / 222 |
The split columns show different rebounding profiles. Reese had 81 more offensive rebounds than Shepard, while Shepard had collected a category-best 304 defensive rebounds among this five-player group. Iriafen's 105 offensive boards also stand out: nearly one-third of her total came at that end. These are descriptive components, not separate claims that one type is always more valuable; defensive rebounds finish stops, while offensive rebounds extend possessions.
Wilson and Austin again illustrate the limits of one-decimal display. Both showed 9.5 RPG, and the official rate list placed Wilson third and Austin fourth. Austin nevertheless had nine more total rebounds because she had played one additional game. The article preserves the official order without guessing at hidden decimal precision. Follow the Atlanta Dream schedule for Reese's remaining games, remembering that any contest after August 26 is outside this table's cutoff.
Assist leaders: creation, games played and turnovers
Alyssa Thomas and Caitlin Clark shared the displayed assist lead at 8.3 per game, with the official table ordering Thomas first and Clark second. Thomas had 300 assists in 36 games; Clark had 290 in 35. Jordin Canada followed at 7.4 per game, then Chelsea Gray at 6.8 and Jackie Young at 6.6. All five cleared both the 31-game participation benchmark and the 150-assist alternative by the cutoff.
| Official APG rank | Player | GP | APG | Total AST | Total TOV | AST:TOV |
|---|---|---|---|---|---|---|
| 1 | Alyssa Thomas, Phoenix | 36 | 8.3 | 300 | 130 | 2.31 |
| 2 | Caitlin Clark, Indiana | 35 | 8.3 | 290 | 161 | 1.80 |
| 3 | Jordin Canada, Atlanta | 37 | 7.4 | 272 | 94 | 2.89 |
| 4 | Chelsea Gray, Las Vegas | 38 | 6.8 | 260 | 106 | 2.45 |
| 5 | Jackie Young, Las Vegas | 38 | 6.6 | 250 | 93 | 2.69 |
The turnover columns are context, not a replacement leaderboard. Canada produced the best assist-to-turnover ratio within this top five at 2.89, while Thomas had the most assists and the official No. 1 APG position. Clark paired elite creation volume with 161 turnovers, the highest total in this group. Those facts can coexist because APG and assist-to-turnover ratio answer different questions: one measures credited creation volume per appearance, while the other compares that output with lost possessions.
Assists are also narrower than “playmaking.” A pass can bend a defense without becoming an assist, and a teammate still has to finish the shot for the passer to receive credit. Screen assists, hockey assists, spacing and attacks that force rotations are not captured in the basic AST column. That is why this table should be read as an official box-score leaderboard, not a complete ranking of the league's smartest or most valuable creators.
The 2.31, 1.80, 2.89, 2.45 and 2.69 ratios above came directly from the official totals response; they were not calculated from rounded per-game figures. The WNBA also treats AST:TOV as its own qualified category with a 50-assist minimum. Keeping that distinction prevents a useful supporting stat from quietly changing the definition of “assists leader.”
Defensive and shooting leaders need different minimums
Individual defense and shooting cannot be summarized with the same eligibility rule. The WNBA's official rate lists put Rhyne Howard first in steals at 2.4 per game and A'ja Wilson first in blocks at 2.0. Shooting accuracy, meanwhile, is qualified by made shots rather than games played. Applying those official volume minimums to the August 26 totals produced the category leaders below.
| Category | Leader at cutoff | Rate | Opportunity / volume |
|---|---|---|---|
| Steals per game | Rhyne Howard, Atlanta | 2.4 | 37 GP, 88 steals |
| Blocks per game | A'ja Wilson, Las Vegas | 2.0 | 36 GP, 72 blocks |
| Field-goal percentage | NaLyssa Smith, Las Vegas | 63.8% | 183 makes on 287 attempts |
| Three-point percentage | Kelsey Mitchell, Indiana | 45.5% | 117 makes on 257 attempts |
| Free-throw percentage | Jackie Young, Las Vegas | 93.4% | 113 makes on 121 attempts |
The shooting denominators protect the leaderboards from tiny samples. Smith was comfortably beyond the 100-field-goal minimum, Mitchell far exceeded the 25-made-three threshold and Young had more than twice the required 50 made free throws. Their percentages therefore combine accuracy with enough completed shots to qualify. An unqualified player may own a higher raw percentage, but that does not make her the official category leader.
Steals and blocks use participation or cumulative-event alternatives. The published full-season marks for 44 games are 31 appearances or 55 steals, and 31 appearances or 40 blocks. During the season, the official rate page applies participation in step with games played, which is why a player below the eventual 31-game mark can appear after playing enough of her team's current schedule. Readers should use the official list at the relevant date instead of applying the final threshold too early.
There is a larger basketball limitation too. A steal records a possession taken away and a block records a shot rejected, but strong defense also includes positioning, communication, disciplined contests, switching and deterring an attempt before it happens. Similarly, field-goal percentage does not account for the extra point on a three or show shot difficulty. These categories identify official leaders in specific events; they are not an all-in-one ranking of the best defenders or most efficient offensive players.
Per-game averages versus season totals
Per-game averages and totals are both factual, but they reward different things. A rate divides recorded production across the games in which the player appeared, answering “how much per appearance?” A season total answers “how much has she accumulated?” That second number reflects availability as well as performance. Neither should be presented as universally superior.
- Name the category and scope. Confirm regular season rather than playoffs, and identify whether the page is sorted by a per-game rate or a total.
- Read GP beside the number. A 30-game sample and a 39-game sample represent different amounts of availability, even when both players qualify.
- Use the rate for nightly pace. Wilson's 26.0 PPG described a higher scoring average than Mitchell's 24.8.
- Use the total for accumulated volume. Mitchell's 967 points exceeded Wilson's 935 after Mitchell played three more games.
The same pattern appears outside scoring. Wilson and Shakira Austin both displayed 9.5 rebounds per game, but Austin had 350 total rebounds in 37 games while Wilson had 341 in 36. Alyssa Thomas and Caitlin Clark both displayed 8.3 assists; Thomas had 300 total in 36 games and Clark 290 in 35. The extra cumulative production does not prove one player was better in every respect. It explains what the totals column measured.
Rounding is another reason not to treat the visible tenths as exact. The official table may order two players who both display 8.3 or 9.5 because the underlying averages differ beyond the shown decimal. This article preserves the league's order but does not publish invented precision. If a one-decimal rate and a listed total look slightly inconsistent when multiplied, use the official total; multiplication starts from a rounded value and can drift.
Team labels require context as well. A season line can include production accumulated before and after a trade even when a provider highlights the player's current team. Before using a team filter, check whether it shows a full-season row, a current-team-only row or separate stints. For the headline leaders here, the safest workflow is simple: verify season type, qualification, GP, the selected per-mode setting and the date of the snapshot. That prevents a rate-versus-total choice from becoming an accidental claim about durability, efficiency or overall value.
Confirmed 2026 WNBA records and milestones
A leader is not necessarily a record-holder. First place in a current season describes position at one cutoff. A WNBA record is a league-wide benchmark confirmed against history; a franchise record applies only to one team; and a milestone marks a cumulative threshold. The official 2026 examples below show why those labels should not be interchanged.
- Single-game rebounds — WNBA record: Angel Reese grabbed 26 rebounds for Atlanta against Los Angeles on August 24. The Dream's official recap says she surpassed the previous record of 24, set by Chamique Holdsclaw in 2003.
- Single-season rebounds — WNBA record: Reese's 20th rebound in that game brought her to 452 and moved her past A'ja Wilson's 2024 record of 451. The official totals table showed 458 through the August 26 cutoff. Because Atlanta still had games left, 458 is the dated current total, not a projected final mark.
- Single-season offensive rebounds — WNBA record: Reese re-set the record with her 173rd offensive rebound on August 20, according to Atlanta's recap. Her official total had risen to 187 by this snapshot. The status is confirmed, while the final number remains open.
- Single-game scoring and three-pointers — tied WNBA records: Marina Mabrey scored 53 points and made nine three-pointers for Toronto against Los Angeles on June 25. Official team coverage calls both record-tying marks. “Tied” matters: the performance matched the league benchmark rather than creating a higher one.
- Career scoring — milestone: Rhyne Howard scored her 3,000th career point during Atlanta's August 24 win. Reaching a round career threshold is an achievement, but the Dream did not describe 3,000 as the league's career scoring record.
- Field goals made — franchise record: Allisha Gray set Atlanta's season mark with her 247th made field goal in the same August 24 game. That record belongs to the Dream's history, not the WNBA-wide record book.
These examples also show why tense and source date matter. Reese had already broken the season records, so past tense is appropriate for the record-setting moments. Her totals were still increasing, so the article reports 458 rebounds and 187 offensive rebounds only as of the snapshot. Mabrey's 53 and nine were completed single-game results and cannot change, while the season leaderboard around her continued moving.
Claims such as “on pace for,” “best since” or “highest among active players” may be useful context, but none automatically means “WNBA record.” A personal best is not a franchise record, and a franchise record is not a league record. This guide uses the strongest label that the official evidence supports and no stronger. A post-season update must recheck current totals while preserving the dates on the completed record-setting games.
How to follow the leaders through the end of the season
The 2026 regular season did not end with this August 26 snapshot. The WNBA scheduled a World Cup break from August 31 through September 16, followed by a September 17 resumption and a Thursday, September 24 regular-season finale. A quiet stretch during the international break therefore does not mean that the scoring, rebounding or assist races are final.
- Start with current results. Open today's WNBA games and scores to see which games are scheduled, live or final. A completed game can immediately change a player's total and may move a rounded average.
- Check remaining opportunities. Use the full schedule linked earlier to compare how many games each team still has around the break. Do not assume every player has the same GP simply because teams are approaching the same 44-game target.
- Return to the official category view. Select regular season, the statistic and either per-game or totals. Recheck qualification, especially for a player near a participation or cumulative threshold.
This article should be updated only after the new games are reflected in the source data. The post-regular-season version needs a fresh pull of every category, confirmation that all 44-game schedules are complete, and a second check of record totals. Until then, “led through August 26” is accurate; “won the 2026 scoring title” is not.
For the wider calendar—including the opening date, break and scheduled finish—see the guide to the 2026 season start and end dates. That page answers calendar intent, while this one remains focused on what the individual leaderboards showed at a specific cutoff.
2026 WNBA stat leaders FAQ
Who leads the WNBA in scoring in 2026?
A'ja Wilson was the qualified scoring-average leader at 26.0 points per game in 36 appearances through games completed on August 26. Kelsey Mitchell led cumulative scoring with 967 points after 39 games, compared with Wilson's 935. The answer therefore depends on whether “leads” means official points per game or total points accumulated.
Who leads the WNBA in rebounds in 2026?
Angel Reese led both main readings at the cutoff: 12.4 rebounds per game and 458 total rebounds in 37 appearances. Her total included 187 offensive rebounds and 271 defensive rebounds. Those were dated values rather than projections, and Atlanta still had regular-season games remaining.
Who leads the WNBA in assists in 2026?
Alyssa Thomas appeared first on the official assists-per-game list, but Thomas and Caitlin Clark both displayed 8.3 assists per game. Thomas had 300 assists in 36 games; Clark had 290 in 35. The public table's one-decimal tie should be preserved instead of creating extra precision. Thomas's first-place ordering is the official ordering at this snapshot.
Do WNBA stat leaders use totals or per-game averages?
They can use either, depending on the selected category and view. Traditional headline leaderboards often rank qualified per-game averages, while totals measure the full amount produced across appearances. Percentage categories require made-shot minimums, and counting-rate categories use participation or cumulative alternatives. Always read the category, GP, qualification rule and per-game-versus-totals setting together.
Are the 2026 WNBA stat leaders final?
No. This article stops after the August 26 games, while the WNBA scheduled the regular season to conclude on September 24. Rates, totals, qualification and records could still change. Final-title language is appropriate only after every regular-season game is complete and the official data has updated; until then, these are leaders at a clearly stated cutoff.
Sign in with Google to join the discussion.