

Last updated September 3, 2026. The 2026 WNBA team-stats picture has four clear leaders through games played on August 30: Indiana has the best offense, Golden State has the best defense, Minnesota owns the best net rating, and Chicago plays at the fastest pace. Those answers come from a single Her Hoop Stats dataset so the possession estimates remain internally consistent.
2026 WNBA team stats snapshot through August 30
Every team had completed 40 games at this cutoff. The table below puts each club's record beside its offensive rating, defensive rating, net rating and estimated pace. Offensive and defensive ratings are points scored or allowed per 100 possessions in the provider's model; pace is estimated possessions per game. Higher is better for offensive rating and net rating, while lower is better for defensive rating.
| Team | Record | Off Rtg | Def Rtg | Net Rtg | Pace |
|---|---|---|---|---|---|
| Minnesota Lynx | 31-9 | 111.4 | 100.5 | +10.9 | 82.5 |
| Golden State Valkyries | 29-11 | 105.5 | 96.7 | +8.8 | 78.2 |
| Las Vegas Aces | 27-13 | 111.0 | 103.6 | +7.4 | 82.0 |
| Indiana Fever | 26-14 | 112.7 | 105.8 | +6.9 | 84.9 |
| Atlanta Dream | 26-14 | 106.6 | 103.0 | +3.6 | 84.0 |
| New York Liberty | 24-16 | 108.5 | 105.0 | +3.5 | 82.3 |
| Dallas Wings | 24-16 | 107.9 | 104.7 | +3.2 | 81.5 |
| Washington Mystics | 24-16 | 101.4 | 101.0 | +0.4 | 80.4 |
| Chicago Sky | 15-25 | 101.6 | 104.6 | -3.0 | 85.0 |
| Phoenix Mercury | 14-26 | 102.1 | 106.6 | -4.5 | 81.9 |
| Los Angeles Sparks | 15-25 | 103.4 | 108.4 | -5.0 | 84.3 |
| Portland Fire | 16-24 | 104.1 | 109.2 | -5.1 | 82.2 |
| Seattle Storm | 8-32 | 98.5 | 104.3 | -5.8 | 84.0 |
| Toronto Tempo | 11-29 | 103.8 | 112.8 | -9.0 | 82.8 |
| Connecticut Sun | 10-30 | 94.8 | 106.3 | -11.5 | 82.7 |
This is an analytical snapshot, not a live widget. The official WNBA standings corroborated every record on the cutoff date, while Her Hoop Stats supplied the ratings and pace estimates. Fans looking for games added after August 30 should use the full 2026 WNBA schedule; later results will change the averages. The table's main value is that it separates efficiency from volume. A team can score many points because it plays quickly, or allow few because it creates fewer possessions. Ratings adjust the comparison to a common possession scale.
How to read offensive rating, defensive rating, net rating and pace
The quickest way to read the table is to imagine that every team receives 100 possessions. Offensive rating estimates how many points a club scores in that standardized span. Indiana's 112.7 therefore means roughly 112.7 points per 100 possessions in this dataset, not 112.7 points in an average game. Higher offensive rating is better because it means a team converts its opportunities more efficiently.
Defensive rating applies the same idea to points allowed. Golden State's 96.7 estimates that opponents scored 96.7 points per 100 possessions, so lower numbers signal stronger prevention. Net rating subtracts defensive rating from offensive rating. Minnesota's 111.4 offense minus its 100.5 defense produces a league-best +10.9. A positive result says the team outscored opponents per 100 possessions; a negative result says it was outscored.
Pace estimates how many possessions a team played in an average game. It is neither a grade nor a ranking of quality. A fast club simply creates more trips up and down the court, which can lift both its scoring and its opponent's scoring. A slow team can be excellent or poor; the same is true of a fast team. Pace is the context that makes raw points per game easier to interpret.
- Off Rtg: points scored per estimated 100 possessions; higher is better.
- Def Rtg: points allowed per estimated 100 possessions; lower is better.
- Net Rtg: Off Rtg minus Def Rtg; higher is better.
- Pace: estimated possessions per game; faster or slower, not better or worse.
One caution matters whenever fans compare sites: possession totals are estimates. Providers can use different formulas, filters and rounding rules, so Basketball-Reference may report a different absolute rating from Her Hoop Stats even when both identify the same leader. Use one source for a full comparison and note its cutoff. Do not take one site's offense number and subtract another site's defense number. That discipline also explains why this statistical snapshot can complement, rather than replace, our editorial 2026 WNBA power rankings.
Indiana owns the best 2026 WNBA offense
Indiana's 112.7 offensive rating is the highest in the 40-game snapshot, narrowly ahead of Minnesota at 111.4 and Las Vegas at 111.0. The ranking is not an artifact of one possession formula: Basketball-Reference and StatMuse produce different absolute ratings, yet both also identify the Fever as the leading offense. That agreement on order is more useful than pretending all providers calculate an identical number.
The conventional box score explains much of what the possession metric is capturing. Indiana averaged a league-high 97.0 points while shooting 49.2% from the field and 39.5% from three. Those percentages mean the Fever did not lead simply by squeezing more shots into a fast game. They combined the second-fastest pace in this dataset with unusually efficient conversion, forcing opponents to defend both the arc and the interior on repeated possessions.
There was still a cost to the aggressive tempo. Indiana averaged 14.5 turnovers, so its attack was not built on perfect ball security. That detail is important: an elite offense can compensate for lost possessions by shooting extremely well, getting to the line or creating other advantages, but turnovers remain an obvious place for an opponent to apply pressure. The Fever's 20.8 assists per game also add useful context without proving that every made basket came from a particular system or player.
Minnesota and Las Vegas formed the next offensive tier. Both scored efficiently at a slower pace than Indiana, which is why raw points per game can underrate their ability to produce on a possession. Their proximity also shows why “best offense” needs a cutoff date. A short hot or cold stretch after the schedule resumes could reorder the top three even if each remains among the league's strongest attacks.
This is a team-level comparison. Fans trying to separate the individual scorers, rebounders and playmakers who power these offenses can use the site's 2026 player stat leaders. Keeping those two questions separate avoids crediting one player for every team possession and keeps this page focused on how efficiently the five-player unit scored.
Golden State sets the defensive standard
Golden State's 96.7 defensive rating is the standout number on the other side of the ball. Minnesota ranks second at 100.5 and Washington third at 101.0. Multiple stat providers identify the Valkyries as the No. 1 defense even though their possession estimates produce different absolute figures, and Golden State's own August 27 game recap described the club as the league's best defense.
The simplest supporting number is 75.4 opponent points per game, easily the lowest figure in the snapshot. Yet Golden State also played at the league's slowest pace, 78.2, so raw opponent scoring does not finish the analysis. Fewer possessions naturally create fewer chances for both teams to score. The more persuasive evidence is that the Valkyries remained first after the comparison was adjusted to 100 possessions.
A late-August win over New York provides a concrete example without defining the whole season. Golden State held the Liberty to 30.2% shooting from the field and 22.6% from three on August 27. One cold-shooting night can be noisy, but repeated suppression over 40 games is what moved the full-season defensive rating well clear of the field. The team's 29-11 record shows that defense translated into wins rather than attractive efficiency alone.
Minnesota's second-place defense is especially meaningful because it is paired with the league's second-best offense. Washington demonstrates a different profile. The Mystics' 101.0 defense ranks third, but their 101.4 offense leaves them at only +0.4 overall. That contrast is why “best defense” and “best team” are not synonyms. A defense can keep games close, but the offense still has to create separation.
When evaluating another club, start with defensive rating rather than opponent points per game, then use pace to understand the raw total. After that, inspect shooting allowed, turnovers forced and rebounding to locate the mechanism. This order prevents a slow team from receiving automatic credit for elite defense and prevents a fast team from being penalized solely because its opponents get more trips.
Minnesota leads the net-rating picture
Minnesota's +10.9 net rating is the best two-way margin in the selected dataset. The Lynx pair the No. 2 offense with the No. 2 defense, a balance that produced a 31-9 record. Basketball-Reference uses a different possession model but still ranks Minnesota first at +10.0, so the conclusion is robust even though the exact decimal depends on the source.
Golden State (+8.8), Las Vegas (+7.4) and Indiana (+6.9) form the next group. For a simple reading aid—not an official WNBA classification—those four teams can be treated as the elite tier at +6 or better. Atlanta (+3.6), New York (+3.5) and Dallas (+3.2) make up a positive middle, while Washington (+0.4) is nearly even. The remaining seven teams were outscored on a per-possession basis.
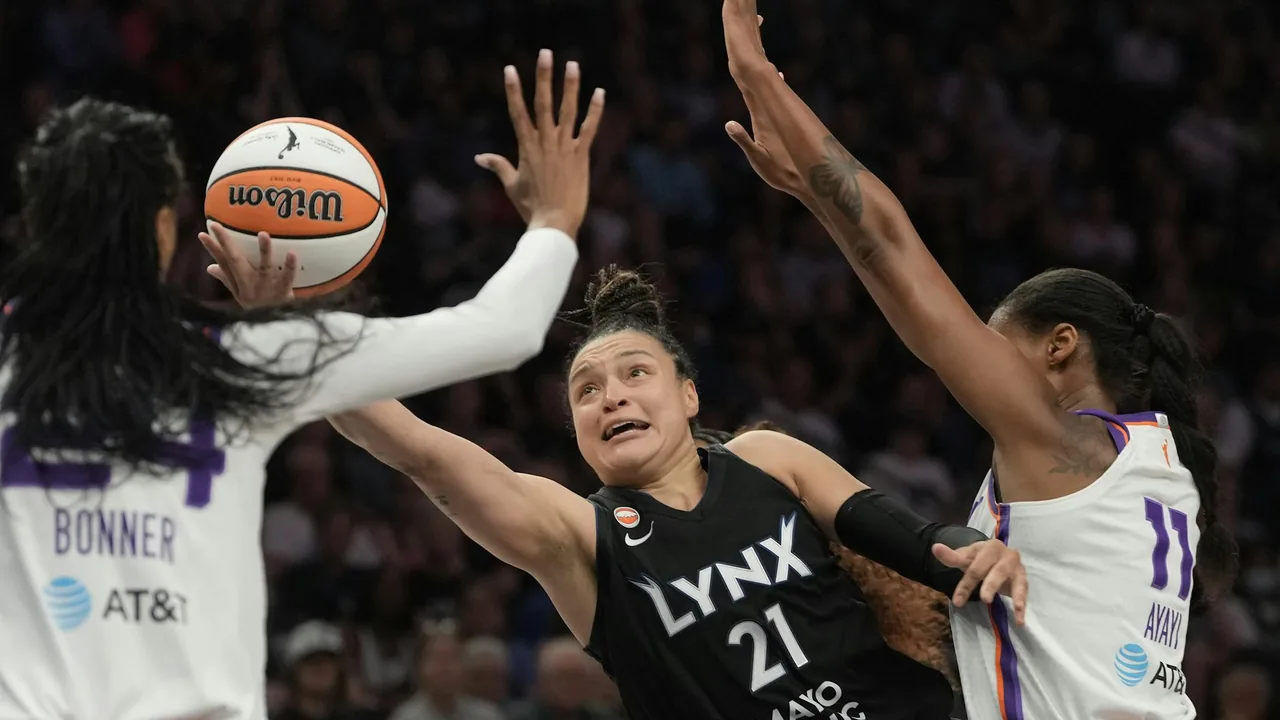
Net rating often describes underlying strength better than a small set of close-game results because every point and possession contributes to the sample. It also helps distinguish teams with identical records. Atlanta and Indiana were both 26-14, but Indiana's +6.9 margin was almost twice Atlanta's +3.6 in this model. New York, Washington and Dallas all stood at 24-16, yet their profiles ranged from a balanced positive margin to a defense-led near-zero result.
Still, net rating is not a championship probability. It does not promise that a club will stay healthy, win a one-possession finish or match up well against one playoff opponent. The remaining schedule can also be uneven, and a 40-game average may hide a roster change or a recent tactical shift. Use the number as a baseline, then compare current availability, opponent and location before making a game-level judgment.
The Minnesota Lynx schedule shows where the league leader plays next, while the current 2026 playoff picture translates records into seed position. Those dynamic pages answer different questions from this fixed table. Here, the central conclusion is narrower: no team had created a larger possession-adjusted scoring margin through August 30.
Chicago and Indiana play fastest, but pace is not quality
Chicago leads this dataset at a 85.0 pace, just ahead of Indiana at 84.9 and Los Angeles at 84.3. Other providers also put Chicago first but display lower absolute estimates, another reminder to compare teams within one table. The useful conclusion is the rank and style: the Sky created the most possessions per game, not that 85.0 is a universal official count.
The records show why pace should never be treated as a quality score. Chicago was 15-25 with a -3.0 net rating, while Indiana was 26-14 and +6.9 at almost the same tempo. The two clubs generated a similar volume of possessions but did dramatically different work with them. Indiana's high-end shooting turned speed into the league's best offense; Chicago's 101.6 offensive rating remained in the lower tier.
Golden State provides the reverse test. The Valkyries played at the slowest pace, 78.2, yet were 29-11 with the second-best net rating. Their deliberate games suppressed raw scoring totals on both sides, but possession adjustment revealed elite defense rather than mere scarcity of opportunities. Washington was also slow at 80.4, though its almost even offense and defense yielded only a +0.4 margin. Slow was a style shared by two very different profiles.
Pace changes how a fan should read a matchup. Two fast teams create more transition chances, more shot volume and potentially a higher raw total. A slow team may try to limit those opportunities, but the opponent, score and personnel can move a single game away from a season average. Pace is therefore a starting expectation, not a promised game script.
For upcoming dates and final scores, return to the live-updating WNBA schedule rather than treating this snapshot as a result feed. Then use pace to add context: if a 90-point night came in an unusually fast game, the offense may have been less dominant than the raw score looks; if it came in a slow game, the efficiency could be exceptional.
Four Factors that explain the team rankings
Offensive, defensive and net ratings tell us what happened per possession. The WNBA Stats Four Factors help diagnose how it happened. The league's official stats FAQ identifies effective field-goal percentage, turnover ratio, offensive-rebound percentage and free-throw attempt rate as four important areas in which winning teams tend to excel. No single factor explains every result, and the balance can differ by team.
- Start with effective field-goal percentage (eFG%). It gives an extra half-make of credit to a three-pointer because three points are worth 1.5 times a made two. This puts two-point and three-point conversion into one shooting measure. Indiana's ordinary FG% and 3P% already suggest why shooting efficiency is central to its offensive lead.
- Check turnover rate. A lost possession produces no shot and may launch an opponent's transition chance. Rate is more comparable than raw turnovers when teams play at different speeds. A fast team may accumulate more total mistakes while still protecting the ball adequately per possession.
- Measure offensive-rebound percentage. This asks what share of available offensive rebounds a team collected, not merely how many boards appeared in the box score. Securing a miss creates another scoring opportunity; allowing one forces a defense to guard an extra action.
- Review free-throw attempt rate. The official definition relates free-throw attempts to field-goal attempts. It provides context for how often a team reaches the line, though the number should not be read as a complete measure of officiating, physicality or shot quality.
Apply the list on both sides. An offense wants to shoot efficiently, preserve possessions, recover misses and generate productive trips to the line. A defense wants to suppress opponent eFG%, force turnovers, finish possessions with rebounds and avoid excessive free-throw opportunities. The official team interface publishes opponent versions of the same factors, making the comparison symmetrical.
A practical team comparison therefore moves from broad to specific: compare net rating, split it into offense and defense, adjust your reading for pace, and then use the Four Factors to locate the gap. If two clubs have similar net ratings, one may rely on shot-making while the other wins the possession battle. That difference can matter in a particular matchup even though the season-level margin is similar. The site's power rankings can then add form, availability and matchup judgment that a static statistical framework deliberately leaves out.
What the numbers mean for the rest of the 2026 season
The cutoff falls at a natural checkpoint. The official WNBA calendar sets an August 31–September 16 break for the FIBA Women's Basketball World Cup, after the league paused following its August 30 games. Play resumes September 17. Because every club had completed 40 of its 44 regular-season games, this is a substantial sample, but four games per team can still alter close races and near-tied statistical ranks.
The clearest signals are the gaps, not tiny decimal differences. Minnesota and Golden State have separated themselves in net rating, Indiana holds a meaningful offensive lead, and Golden State owns a sizable defensive advantage. By contrast, Atlanta, New York and Dallas sit within four-tenths of one another in net rating. A single strong or poor performance can reorder that middle group, so it would be false precision to treat the August 30 rank as permanent.
Use these ratings as a baseline when the schedule resumes. First identify each team's season profile. Next check recent availability and opponent. Then decide whether the matchup is likely to amplify or attack that profile. Finally, use today's WNBA games and scores for the current slate instead of relying on a dated article. After the regular season, this page should be refreshed as a final 44-game review rather than leaving stretch-run language in place.
Which WNBA team has the best offense in 2026? Indiana leads the selected August 30 dataset with a 112.7 offensive rating. Other major providers also rank the Fever first, though the displayed rating differs by possession formula.
Which WNBA team has the best defense in 2026? Golden State ranks first at 96.7 points allowed per 100 estimated possessions in this dataset. The Valkyries also allowed the fewest raw points per game, and their No. 1 adjusted ranking shows the result was not only slow pace.
Who leads the WNBA in net rating? Minnesota leads at +10.9, ahead of Golden State at +8.8. The Lynx reached that margin by ranking second on both offense and defense rather than dominating only one side.
Which team plays at the fastest pace? Chicago ranks first at 85.0 estimated possessions per game in this source, one-tenth ahead of Indiana. Pace describes speed, not effectiveness: Chicago's net rating remained negative while Indiana's was strongly positive.
Why are the ratings different on another site? Providers estimate possessions, apply filters and round data differently. Compare all teams within one source and date range. The ranking can agree even when the printed value does not.
Is net rating better than win-loss record? It answers a different question. Record decides standings and playoff seeds; net rating describes the average scoring margin per 100 possessions. Use the official record for position and net rating for performance context. Close-game outcomes, injuries and matchup details still matter, so neither number should stand alone.
Sign in with Google to join the discussion.